COUNTIES WITH HIGH COVID-19 RISK: SET #4
Zooming in: counties where risk grows with housing debt
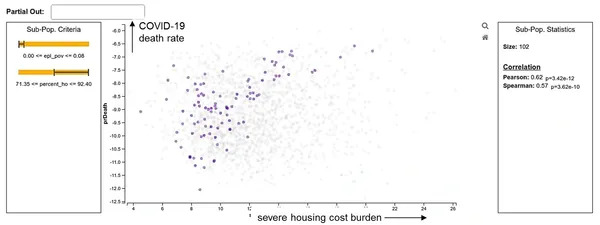
We extended our automated pattern mining engine to not only identify patterns of counties where the COVID-19 death rate was consistently above US average, but also where a significant correlation with a county attribute existed.
Among others, it revealed that there was a statistically significant linear relationship between severe housing debt and COVID-19 death rate, but only for counties where the percent of home ownership was greater than 71% and where the ratio of residents living below the ethical poverty line (EPL) was less than 8%.
These counties are the purple points in the scatterplot on the left. Considering only these 102 counties raises the correlation to a moderate to high level of 62%. Recall that the correlation of this factor for all counties (grey points) as a whole is negligible.
Definitions:
Severe housing cost burden: HUD defines cost-burdened families as those “who pay more than 30 percent of their income for housing” and “may have difficulty affording necessities such as food, clothing, transportation, and medical care.” See this link for more information.
Ethical poverty line (EPL): The standard poverty line measure of $1-a-day has been found to be unrealistically low as it disguises the real level of global poverty. As is argued in this article, the poverty line of between $2 and $3-a-day would provide a more adequate measure of well-being and a better estimate of the cost of eliminating poverty.
Takeaways
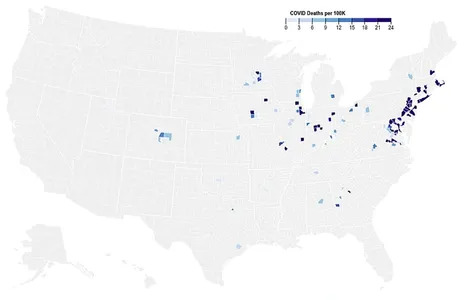
One might speculate that residents of these counties are typically well-to-do and live in houses or apartments they own. The map on the left shows the counties that fit this description.
These counties differ in the housing debt burden rate; the higher the rate, the darker the color. And due to the correlation relationship we found, darker colors also denote higher COVID-19 death rates.
We observe the higher affected (dark blue colored) counties are primarily in the Northeast region of the US, as well as in the large metropolitan areas in the Midwest near the big lakes.
While these counties have been widely reported in the News, our analysis explains at a deeper level the specific characteristics that are shared among all of them which, when coupled with high housing debt burden, can make them particularly vulnerable to COVID-19 mortality.
While there are other US counties that also incurred high COVID-19 death rates, they are not characterized in this way. They have other explanations which we have derived as well in our studies.
As one might imagine, there are homeowners in these rich counties with high home ownership who cannot really afford their homes and as a result run high housing debt. These homeowners struggle for money and likely do not do have the luxury of hunkering down at their house, but have to take up jobs that require them to work outside.
They also might not have the funds for immediate medical care, and can’t afford food delivery and possibly even a car, requiring them to take public transportation. Then, as the percentage of these types of homeowners in a county grows, so does the risk of COVID-19 infection and eventually death.
Of course these are speculations at this point, requiring further research. But at least now we know where to look and explore. Insights of this nature can inform the allocation of COVID-19 testing kits, testing stations, primary care units, and others. They can also focus community guidance and health policy in general.