Examples of Akai Kaeru at Work in Advancement Analytics
Akai Kaeru’s Explainable AI for Advancement Analytics
Our software can quickly identify the conditions under which features become important and then uncover the causal relations that connect them. First, our pattern mining engine identifies groups of data items with shared characteristics. These patterns are then passed on to our easy-to-use interactive Visual Pattern Explorer where analysts can inspect and act upon them. Use cases in Advancement Analytics include:
- Segmentation analysis: Automatically discover and succinctly characterize the type of donor who will likely make a lifetime endowment or even a planned gift
- Donor generation: Discover the most valuable donation prospects in your database and beyond
- Strategy development: Devise multipronged fundraising campaigns that link the predicted response rates with the specificity of donor characterization
- Explainable recommendations: View easy to understand visual explanations on why a prospect is more likely to donate
- Verify hypotheses: Follow your instincts via simple mouse-click interactions and quickly learn about the predicted response rate for your intended target group


Devise Profitable Fund Raising Strategies for a Large Public University
This study uses a dataset we obtained through collaboration with a public university with over 50,000 under-graduate and graduate students and over 24,000 faculty and staff. The dataset has 168 attributes covering demographic and academic information as well as donations for 2,054 donors (1,093 managed and 961 unmanaged). The goal was to identify regions in this feature space that are occupied with similar donors that all respond in a similar way to a given target variable of interest, here the type of donation. All data refer to the year 2018 and earlier.
We used AK Miner to identify groups of donors for which Lifetime Endowments were unusually high or low. These groups were statistically robust and defined by simple criteria (e.g., donation history, demographics, type and origin of degree, etc.). We then switched to AK Visual Pattern Explorer to view and further explore this information, as seen in the figures below.
Akai Kaeru’s XAI Dashboard:
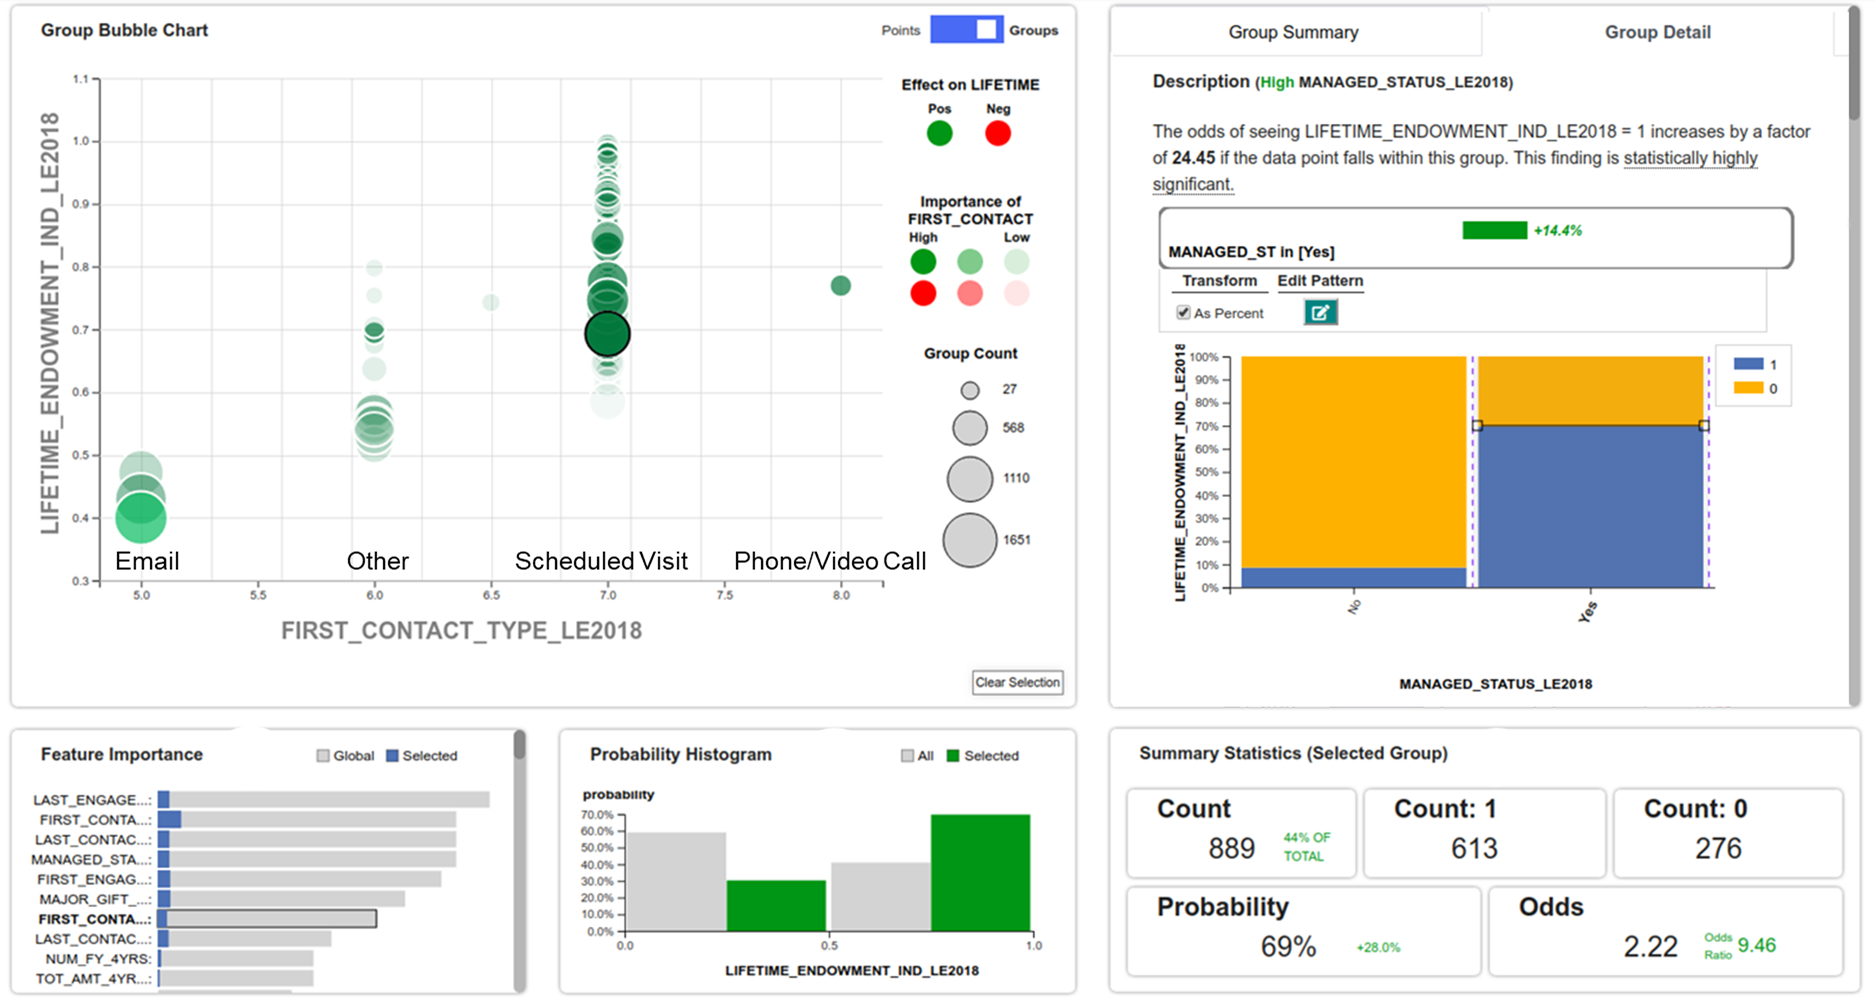
In this dashboard, we explore the attractive fundraising instrument of Lifetime Endowment. We begin by inspecting the plot on the bottom left (Feature Importance) where we learn about the features most important to Lifetime Endowment. An interesting variable for marketing efforts is First Contact Type (7th most important feature).
After clicking on the First Contact Type bar the software brings up the Group Bubble Chart. Each circle in this chart represents a group of donors that are similar in some way and in which the commitment to making a Lifetime Endowment (the y-axis) has been unusually high. The position of the bubbles on the x-axis is determined by First Contact Type. We learn that Email (5.0) seems rather ineffective and while Phone/Video Call (8.0) looks better there is only one rather small group that has apparently responded to it. On the other hand, Scheduled Visit (7.0) seems to have more promise; there are multiple groups placed at different positions along the y-axis. The higher up the bubble is placed the higher the proportion of donors that are part of this group. Clicking on the large solid green bubble at y = 0.7 brings up information on the bubble’s group in the Summary Panel on the right.

Further explorations of this dataset using our software reveal many more valuable insights, such as:
- The type of secret donor who will end up making a Planned Gift
- The university program which produces the most probable unmanaged lifetime donors
- Tthe characteristics profiles of people who will most likely contribute to the campus radio station
Our software makes finding all of these insights as easy as a click of a button. We conducted the entirety of our Advancement Analytics study in a couple of hours. You can read about the details of our study, and how we arrived at these results, in the slides and paper posted here.